
Water resources have a crucial role in different sectors, as well as a great role in drinking water supply. Due to a number of significant factors, such as population growth, industrialization, and urbanization, the quality of ground or surface water has deteriorated. Therefore, an efficient water quality analysis method like the Water Quality Index (WQI) is required to protect water resources (e.g., rivers) (Pesce and Wunderlin, 2000). The river WQI is one of the most effective methods to analyze the quality of river water, as it is a very suitable and unique technique to select an appropriate treatment method for removing different pollutants from the water. Several versions of river WQI models have been developed and widely applied for river water quality assessment due to their simplicity, ease-of-use, and generalized structure (Tyagi et al., 2013).
Table 1. Main river water quality index methods: merits and demerits
WQI methods | Merits | Demerits |
|---|---|---|
Canadian Council of Ministers of the Environment Water Quality Index (CCME-WQI) | Flexible when selecting the input parameters. Easy to calculate | Easy to manipulate Sensitive to the index formulation. |
National Sanitation Foundation Water Quality Index (NSF-WQI) | Uses a rapid and objective way to sum up the data The index value can show the potential water use | Data may get lost Can not properly deal with the uncertainty and subjectivity present in complex environmental problems |
Weight Arithmetic Water Quality Index (WA-WQI) | Describes the suitability of surface and ground water for human consumption It is useful for informing the public and policymakers about water quality. | Not suitable for some uses of water quality data Only quantifies the direct impacts of pollution on a water body |
Oregon Water Quality Index (O-WQI) | Sensitive to significant impacts on the water quality Sensitive to changes in the environment | Cannot properly evaluate all toxic elements Cannot properly determine the quality of water for particular uses |
1. Water Quality Index
In recent decades, natural factors including hydrological, climatic, and topographical factors and human activities including mining, livestock production, agriculture, industrial activities, and heavy metal pollution have caused the degradation of both surface and ground water quality (S´anchez et al., 2007; Magesh et al., 2013; Uddin et al., 2018). Developing countries have faced significant issues when trying to enhance water sanitation and supply or protect the quality of river water (Kannel et al., 2007; Ortega et al., 2016). Even developed countries have been trying to face some of the main problems, like nutrient enrichment and eutrophication of surface water, to maintain the status of their water quality (Abbasi and Abbasi, 2012; Debels et al., 2005). Due to the importance of drinking water quality to human health and raw water quality to aquatic species, it is vital to assess river water quality (Ouyang, 2005).
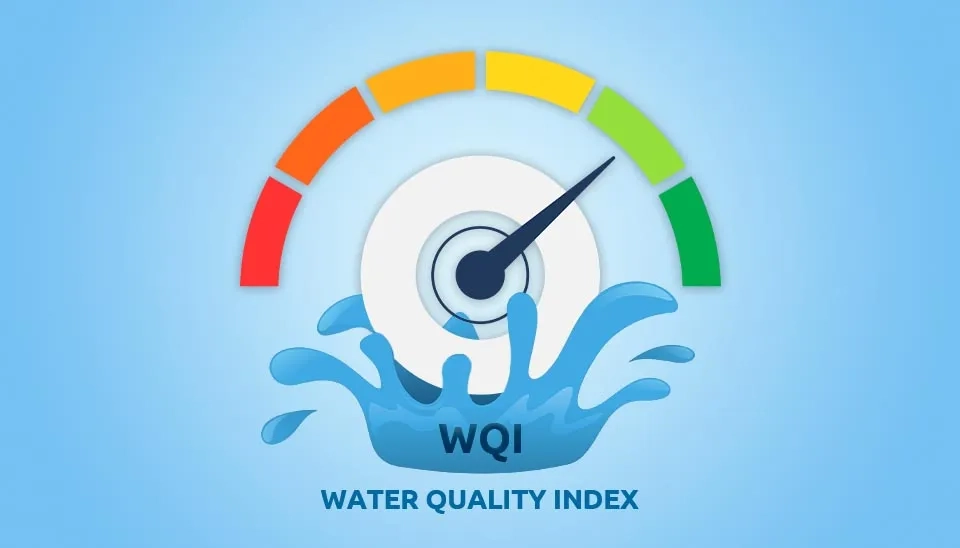
Horton (1965) and Brown (1970) initially proposed the use of the river Water Quality Index (WQI). This method gives a comprehensive view of the water quality for most domestic uses. WQI is a mathematical tool that is used to convert large quantities of water property data to a single number, which represents the level of water quality (Bordalo et al., 2006). This method mostly involves nine or more parameters, including DO, BOD, pH, TDS, and fecal Coliforms (E. coli).
The river WQI is commonly used and developed for surface waters (e.g., rivers) with a focus on aquatic use and less intended for irrigational, recreational, and drinking uses (Simões et al. 2008). In addition, for agricultural applications, the use of WQI is still at an early stage (Almeida et al. 2008). However, some efforts have been made to index the groundwater quality for drinking purposes. This paper reviews the main methods and stages of river water quality index as well as highlights the advantages and disadvantages of different formulations.
2. Water Quality Index Stages
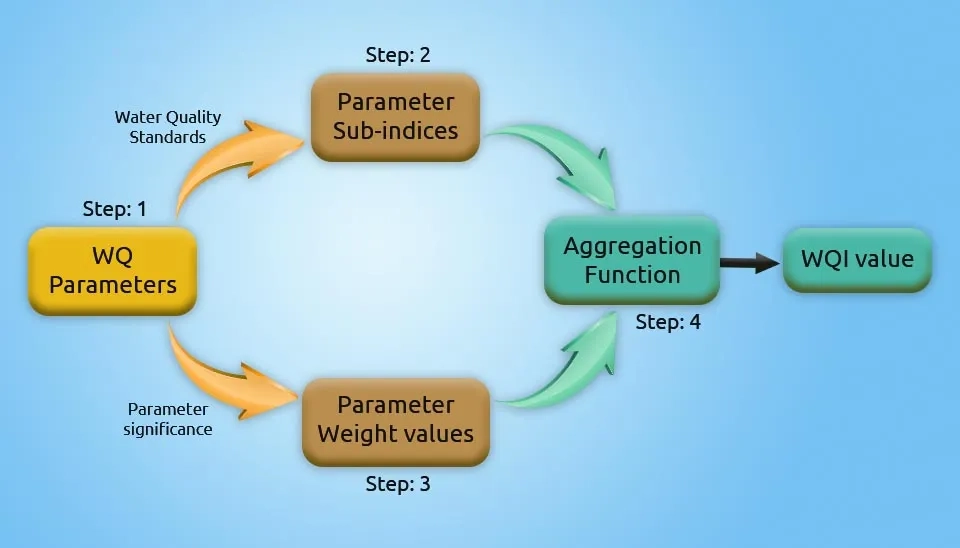
General WQI models that are used to evaluate river water quality involve four main stages, which are described in the following (Lumb et al., 2011; Sutadian et al., 2018; Sun et al., 2016; Fernandez et al., 2012):
(1) Selection of parameters: this can be decided by the judgment of agencies, professional experts, or government institutions. It is recommended to select the variables from five classes, including eutrophication, oxygen level, health aspects, dissolved substances, and physical characteristics, which highly affect the water quality.
(2) Generation of sub-indices for each parameter: the water quality data are monitored, and the concentration of each water quality parameter is converted to a single-value dimensionless sub-index.
(3) Calculation of the parameter weighting values: the weighting factor is determined for each water quality parameter.
(4) Aggregation of sub-indices to compute the overall water quality index: an aggregation function that uses sub-indices and weighting factors of all water quality parameters is used to calculate the final single-value water quality index.
3. Water Quality Index Methods
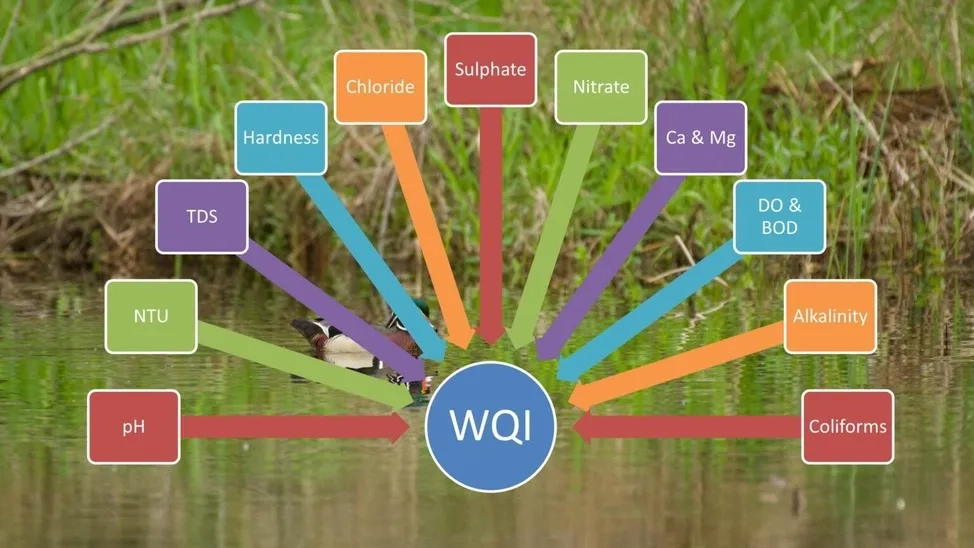
River WQI, which aggregates the measurements of water quality parameters, expresses the quality of river water. The water samples can be framed in one of the following categories, based on the value obtained by the measurement of the river water quality index: excellent, good, poor, very poor, and undrinkable (Lumb et al., 2011; Ismail and Robescu, 2017; Boah et al., 2015). To generally calculate the index, the following physical, chemical, and biological parameters should be determined: temperature, pH, DO, TDS, the electrical conductivity, alkalinity, the Chemic Consumption of Oxygen (CCO), nitrites, chlorides, metals (Pb2, Zn2, Ni2, etc.), and hardness (Sharma et al., 2014; Stoica et al., 2016).
A number of methods have been established to determine the river water quality index. The final selection of the method to determine the quality of the water stream depends on the purpose of the study and the nature and complexity of the river water quality. However, the scientists have not been able to choose the best method that can be used worldwide. Furthermore, there is no method of water quality assessment that can guarantee 100% objectivity and accuracy (Uddin et al., 2017). Weight Arithmetic Water Quality Index (WA-WQI), National Sanitation Foundation Water Quality Index (NSF-WQI), Canadian Council of Ministers of the Environment Water Quality Index (CCME-WQI), Oregon Water Quality Index (O-WQI), etc. have been established by different national and international organizations. Each of these methods has been used to evaluate the river water quality in a particular region. In addition, selecting a proper method is highly related to different numbers and types of water parameters (Chaturvedi and Bassin, 2010). In the following section, the pros and cons of each method will be discussed.
3.1. NSF-WQI
The majority of the indices are based on WQI, which the U.S. National Sanitation Foundation (NSF) created in 1970 and is the most widely used method worldwide (Brown, 1970). A standard method for comparing water quality from different sources has been developed by the NSF-WQI, which mainly includes nine water quality parameters, such as pH, temperature, turbidity, nitrates, turbidity, etc. (Chaturvedi and Bassin, 2010). According to the NSF-WQI method, the water quality range is defined as excellent, good, medium, bad, and very bad.
Table 2. Water quality rating in NSF-WQI method
WQI Value | Rating of Water Quality |
|---|---|
91-100 | Excellent water quality |
71-90 | Good water quality |
51-70 | Medium water quality |
26-50 | Bad water quality |
0-25 | Very bad water quality |
3.1.1. Advantages of NSF-WQI
It uses a rapid and objective way to sum up the data, referring to the parameters in one value
In different regions, the evaluation of water quality changes.
The index value can show the potential water use.
3.1.2. Disadvantages of NSF-WQI
The data may get lost during data handling.
A complex scale of water quality parameters is not used in this method.
It can not properly deal with the uncertainty and subjectivity present in complex environmental problems (Tyagi et al., 2013; Paun et al., 2016).
3.1.3. WQI Calculation Using NSF-WQI
The mathematical expression for NSF-WQI is given by (Marselina et al., 2022):
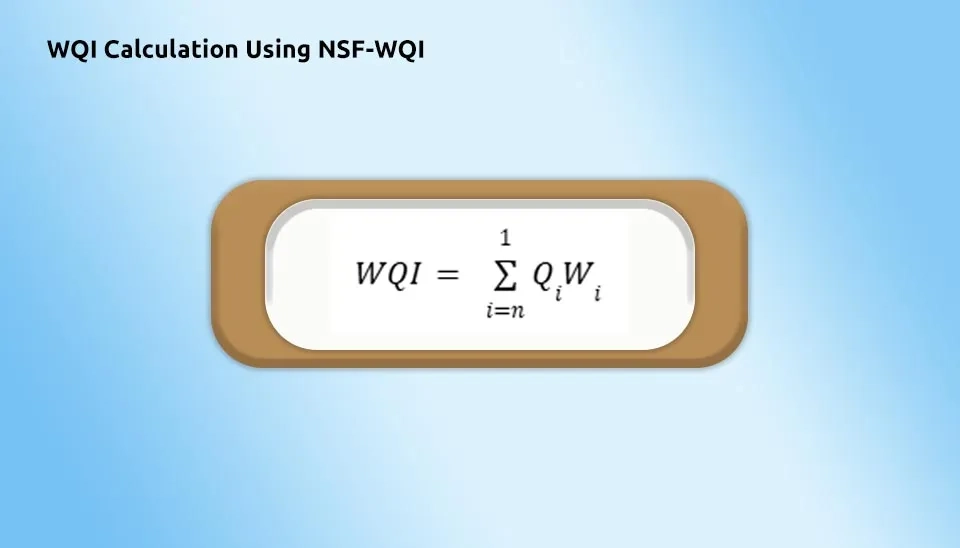
Qi = Sub-index for i-th water quality parameter;
Wi = Weight of the i-th water quality parameter;
n = number of water quality parameters.
Table 3. Parameters used in NSF-WQI method
Table. Parameters used in NSF-WQI method
Parameters | Weight |
Total solids | 0.07 |
pH | 0.11 |
Temperature | 0.1 |
Do | 0.17 |
BOD | 0.11 |
Total phosphorus | 0.1 |
Nitrate | 0.1 |
Fecal coliforms | 0.16 |
Turbidity | 0.08 |
NSF-WQI Parameters Used for Water Quality Assessment
3.2. CCME-WQI
A common method that has been set up by Canadian jurisdictions to provide information on water quality for both management and the general public is the CCME-WQI method. This method can be used by several water agencies in many countries with slight modifications (Lumb et al., 2006). The main purpose of the CCME-WQI is to assess the surface water quality to protect aquatic life. Since the parameters related to different measurements can differ from one station to the next, the sampling process needs at least four parameters and four times sampling (Khan et al., 2005). According to the CCME-WQI method, the water quality range is defined as excellent, good, fair, marginal, and poor.
Table 4. Water quality rating in CCME-WQI method
WQI Value | Rating of Water Quality |
95-100 | Excellent water quality |
80-94 | Good water quality |
60-79 | Fair water quality |
45-59 | Marginal water quality |
0-44 | Poor water quality |
3.2.1. Advantages of CCME-WQI
It represents measurements of a variety of variables in a single number.
It is flexible when selecting the input parameters.
Easy to calculate
This method can statistically simplify complex multivariate data
For managers and the general public, it is a clear and intelligible diagnostic.
At a particular location, it is very suitable for water quality assessment.
This method can easily adapt to different legal requirements and a variety of water uses.
It is not sensible in the case of missing data
It can analyze data coming from automated sampling.
3.2.2. Disadvantages of CCME-WQI
Loss of information on single variables and interactions between variables.
Easy to manipulate
Information on the objectives specific to each location and the specific water use may get lost
The results may be sensitive to the index formulation.
Not flexible enough to be used in different ecosystem types.
While determining the index, all the variables have the same importance.
It cannot be combined with other indicators or other biological data (Abbasi and Abbasi, 2012; Călmuc et al., 2018).
3.2.3. WQI Calculation Using CCME-WQI
The calculation of index scores in the CCME-WQI method can be obtained by using the following relation (Marselina et al., 2022):
F1= The percentage of the total parameters that do not meet the standards calculated by:
F2= The percentage of the individual tests that do not meet the standards calculated by:
F3= The amount of relativity by which the test values fail to meet the standards calculated by:
Nse is the collective amount by which the test values fail to meet the standards calculated by:
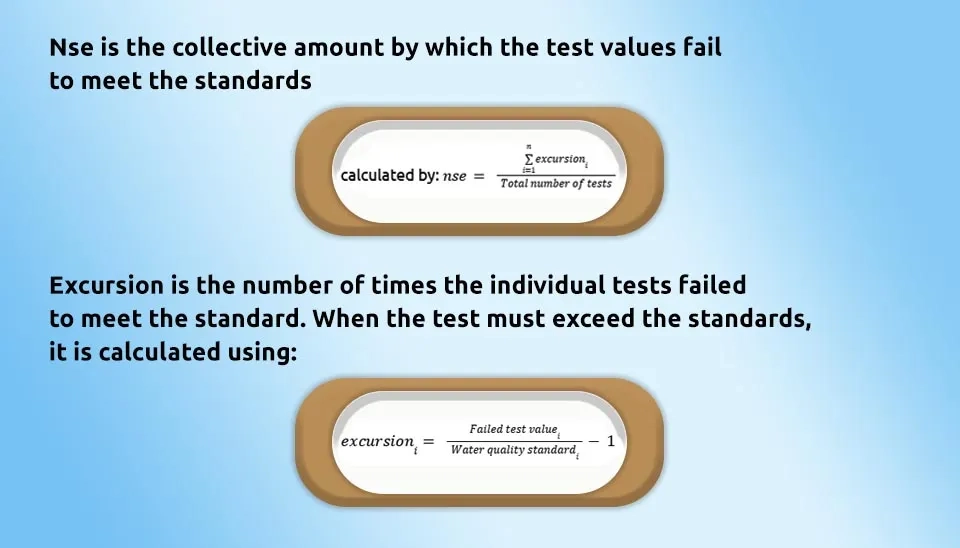
Excursion is the number of times the individual tests failed to meet the standard. When the test must exceed the standards, it is calculated using:
Table 5. Parameters used in CCME-WQI method
Table. Parameters used in CCME-WQI method
Parameters | |
Total solids | COD |
pH | Oil and Grease |
Temperature | Detergent |
Do | Phenol |
BOD | Free Chlorine |
Total phosphorus | Fecal coliforms |
Nitrate | Total Coliform |
Parameters used in CCME-WQI method
3.3. Oregon WQI
The parameters that are evaluated in this method are pH, total solids, temperature, BOD, DO, ammonia, nitrate nitrogen, total phosphorus, and fecal coliform. After the NSF-WQI, the original Oregon WQI was designed and developed, which expresses water quality status for the legislatively mandated assessment. This index does not depend on arbitration in weighting the parameters, and it uses a harmonic averaging concept (Tyagi et al., 2013). According to the O-WQI method, the water quality range is defined as excellent, good, fair, poor, and very poor.
Table 6. Water quality rating in O-WQI method
WQI Value | Rating of Water Quality |
90-100 | Excellent water quality |
85-89 | Good water quality |
80-84 | Fair water quality |
60-79 | Poor water quality |
0-59 | Very poor water quality |
Water quality rating in O-WQI method
3.3.1. Advantages of Oregon WQI
The most affected parameter is allowed to have the greatest influence on the river water quality index by the unweighted harmonic square mean formula used to combine the sub-indices.
At different times and locations, different water quality parameters will pose differing significance to overall water quality.
This method is sensitive to significant impacts on the water quality and to changes in the environment.
3.3.2. Disadvantages of Oregon WQI
It cannot properly evaluate all toxic elements, like bacteria and metals.
It does consider altering the toxic concentrations, biology, and habitat.
It is not possible to make inferences about water quality conditions outside the ambient network site location.
It cannot properly determine the quality of water for particular uses.
Without considering all physical, chemical, and biological data, it cannot be used to provide definitive information about the water quality (Cude, 2001; Tyagi et al., 2013; Paun et al., 2016).
3.3.3. WQI Calculation Using Oregon WQI
The mathematical expression of the Oregon WQI method is given by (Marselina et al., 2022):
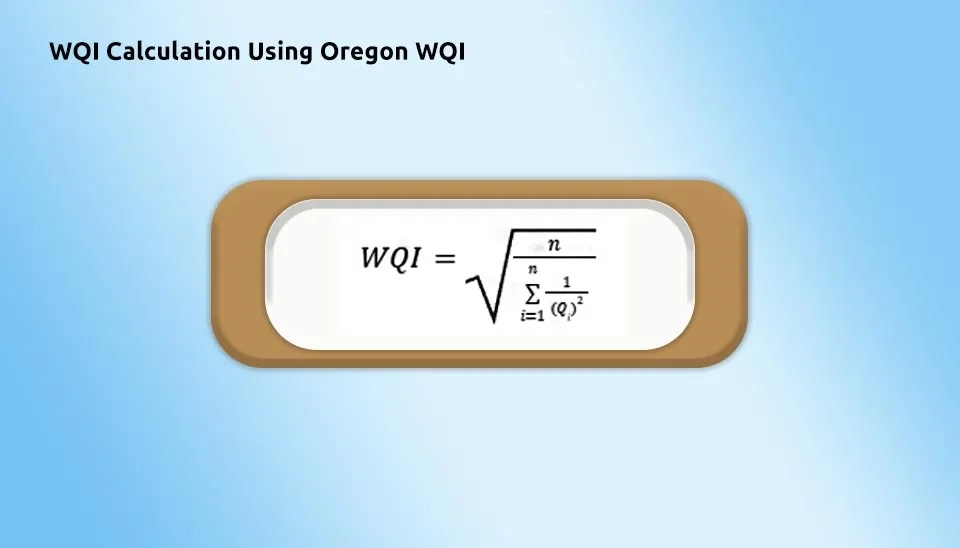
Qi= The sub-index for the i-th water quality parameter
n= The number of water quality parameters.
Table 7. Parameters used in Oregon WQI method
Parameters | |
1 | Total solids |
2 | pH |
3 | Temperature |
4 | Do |
5 | BOD |
6 | Total phosphorus |
7 | Ammonia and nitrate |
8 | Fecal coliforms |
Parameters used in Oregon WQI method
3.4. Weight Arithmetic WQI
The Weight Arithmetic WQI method classifies the water quality according to the degree of purity and by using common variables. This method has been widely applied by many scientists around the world (Chauhan and Singh, 2011; Balan et al., 2012). According to the WA-WQI method, the water quality range is defined as excellent, good, poor, very poor, and unsuitable for drinking purposes.
Table 8. Water quality rating in WA-WQI method
WQI Value | Rating of Water Quality |
0-25 | Excellent water quality |
26-50 | Good water quality |
51-75 | Poor water quality |
76–100 | Very Poor water quality |
Above 100 | Unsuitable for drinking purposes |
Water quality rating in WA-WQI method
3.4.1. Advantages of Weight-Arithmetic WQI
It indicates that each parameter has a significant role in the management and evaluation of the water quality.
This method incorporates data from water quality parameters into a mathematical equation, which results in rating the water body with numbers.
It describes the suitability of both surface water and underground water for human consumption.
It is useful for informing the general public and policymakers about overall water quality.
3.4.2. Disadvantages of Weight-Arithmetic WQI
This index is not suitable for some uses of water quality data
It cannot provide enough information about the quality of the water.
This method only quantifies the direct impacts of pollution on a water body.
Some of the parameters that can describe the quality of the water body are not included in this index (Yogendra and Puttaiah, 2008; Akoteyon et al., 2011; Paun et al., 2016).
3.4.3. WQI Calculation Using Weight-Arithmetic WQI
The calculation of WQI was made by using the following equation (Tyagi et al., 2013):
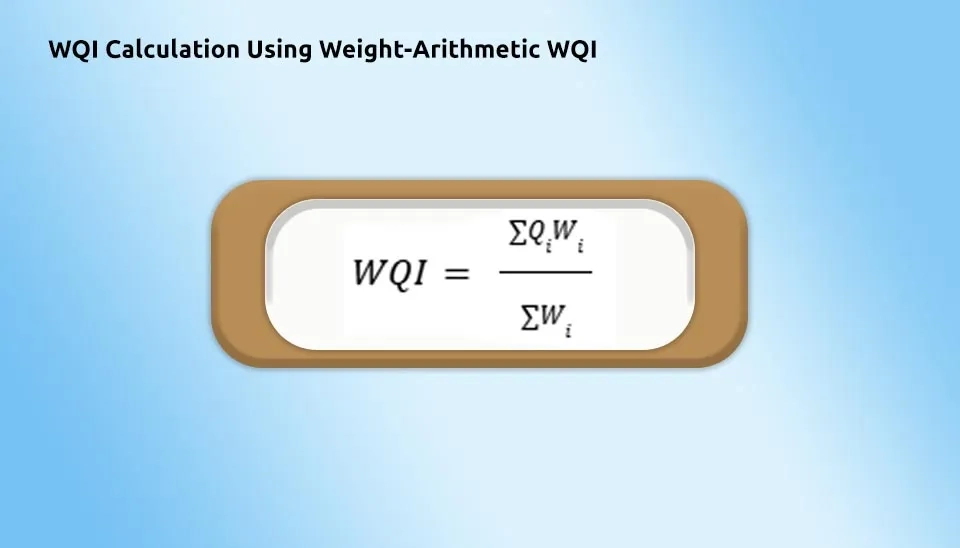
Qi= The quality rating scale can be calculated for each parameter by:
Vi is the estimated concentration of the i-th parameter in the analyzed water.
Vo is the ideal value of this parameter in pure water: Vo = 0 (except pH =7.0 and DO = 14.6 mg/l).
Si is recommended standard value for i-th parameter
The unit weight (Wi) for each water quality parameter is calculated by using the following formula: Wi= K/Si
K = Proportionality constant, which can be calculated by using the following equation:
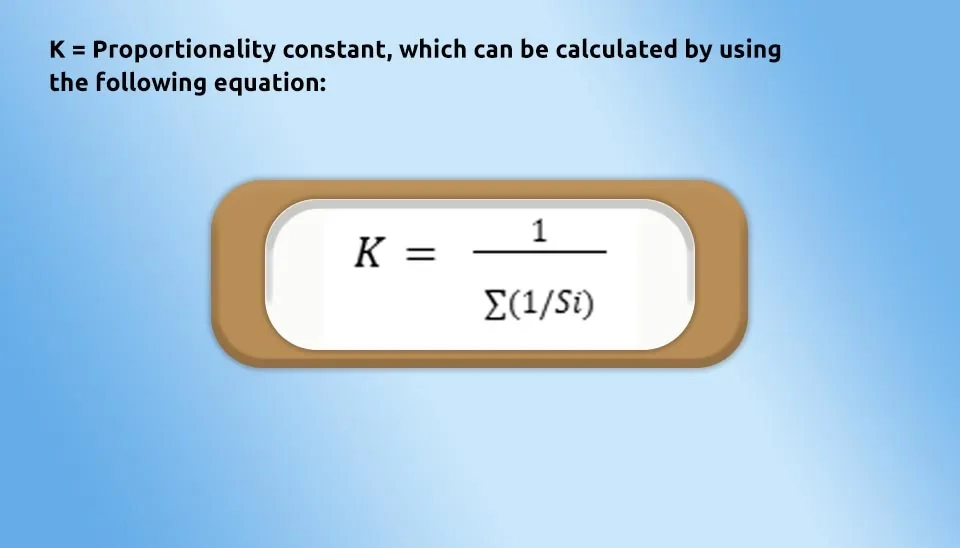
Table 9. Parameters used in Weight-Arithmetic WQI method (Yogendra and Puttaiah, 2008)
Parameters | |
1 | TDS and TSS |
2 | pH |
3 | Electrical Conductivity |
4 | Total hardness |
5 | Calcium |
6 | Magnesium |
7 | Chlorides |
8 | Nitrate |
9 | Sulphate |
10 | DO and BOD |
Parameters used in Weight-Arithmetic WQI method (Yogendra and Puttaiah, 2008)
4. Conclusion
The river water quality index method has been commonly used to evaluate the quality of water (surface water and groundwater) based on local water quality criteria. Since its development, it has become a popular tool due to its generalized structure and simplicity. River WQI can be applied to determine the river water quality as well by using different methods, including NFS-WQI (includes 9 parameters), CCME-WQI (includes 14 parameters), OWQI (includes 8 parameters), and WA-WQI (includes 10 parameters). These four methods have some pros and cons, and choosing one of them depends on the area, study purpose, available data, and the nature of the water. All indices have some limitations; selecting the perfect one is still a challenge, and no index has been globally accepted so far. It is necessary to compare the effectiveness, adequacy, etc. of the existing WQI methods to eventually choose a flexible and universally applicable model to evaluate the river water quality for different uses and in various locations.